Download Microsoft Azure Data Fundamentals.DP-900.CertDumps.2022-08-26.161q.vcex
| Vendor: | Microsoft |
| Exam Code: | DP-900 |
| Exam Name: | Microsoft Azure Data Fundamentals |
| Date: | Aug 26, 2022 |
| File Size: | 8 MB |
| Downloads: | 55 |
How to open VCEX files?
Files with VCEX extension can be opened by ProfExam Simulator.
Discount: 20%
Demo Questions
Question 1
You need to ensure that users use multi-factor authentication (MFA) when connecting to an Azure SQL database.
Which type of authentication should you use?
- service principal authentication
- Azure Active Directory (Azure AD) authentication
- SQL authentication
- certificate authentication
Correct answer: B
Explanation:
https://docs.microsoft.com/en-us/azure/azure-sql/database/authentication-mfa-ssms-overview https://docs.microsoft.com/en-us/azure/azure-sql/database/authentication-mfa-ssms-overview
Question 2
What is a benefit of hosting a database on Azure SQL managed instance as compared to an Azure SQL database?
- built-in high availability
- native support for cross-database queries and transactions
- system-initiated automatic backups
- support for encryption at rest
Correct answer: B
Explanation:
https://docs.microsoft.com/en-us/azure/azure-sql/database/features-comparison https://docs.microsoft.com/en-us/azure/azure-sql/database/features-comparison
Question 3
The visualizations on the Power BI dashboard are known as
- Canvas
- Elements
- Tiles
- Reports
Correct answer: C
Explanation:
Power BI dashboard, also known as Canvas, is a single page that tells a story with the help of visualizations.The visualizations that are present on the Power BI Dashboard are known as Tiles. Once you select a tile, you will move to the report page where that visualization was created.Option A is incorrect. Not visualizations but the Power BI dashboard is known as Canvas.Option B is incorrect. There is nothing like Elements on the Power BI dashboard.Option C is correct. The visualizations that are present on the Power BI Dashboard are known as Tiles.Option D is incorrect. The visualizations come from the reports, these are not the reports.Reference: To know more about the Visualization in Microsoft Power BI, refer to the documentation below from Azure:https://docs.microsoft.com/en-us/power-bi/consumer/end-user-dashboards Power BI dashboard, also known as Canvas, is a single page that tells a story with the help of visualizations.
The visualizations that are present on the Power BI Dashboard are known as Tiles. Once you select a tile, you will move to the report page where that visualization was created.
Option A is incorrect. Not visualizations but the Power BI dashboard is known as Canvas.
Option B is incorrect. There is nothing like Elements on the Power BI dashboard.
Option C is correct. The visualizations that are present on the Power BI Dashboard are known as Tiles.
Option D is incorrect. The visualizations come from the reports, these are not the reports.
Reference: To know more about the Visualization in Microsoft Power BI, refer to the documentation below from Azure:
https://docs.microsoft.com/en-us/power-bi/consumer/end-user-dashboards
Question 4
Which of the following are the characteristics of real-time data processing? (Select 2 Options)
- Expected low latency
- Periodic data processing
- Data is processed just after creation
- Acceptable high latency
Correct answer: AB
Explanation:
Real-time processing is simply defined as the processing of the unbounded stream of input data, with minimized latency requirements for processing, measured periodically even in seconds or milliseconds.Option A is Correct. Real-time processing occurs with very short latency requirementsOption B is Correct. In real-time processing, the processing of input data takes place periodically with short turnaround time i.e. seconds or milliseconds.Option C is incorrect. In real-time processing, the processing of input data stream takes place with a shorter turnaround time. It is stream processing where processing is done just after the data is created.Option D is incorrect. One of the main characteristics of the real-time data processing is that the processing of input data stream takes place with the minimized latency requirements to support real-time consumption, so high latency is not acceptable with real-time data processing.Reference: To know more about the Real-time Processing, refer to the documentation below from Azure:https://docs.microsoft.com/en-us/azure/architecture/data-guide/big-data/real-time-processing Real-time processing is simply defined as the processing of the unbounded stream of input data, with minimized latency requirements for processing, measured periodically even in seconds or milliseconds.
Option A is Correct. Real-time processing occurs with very short latency requirements
Option B is Correct. In real-time processing, the processing of input data takes place periodically with short turnaround time i.e. seconds or milliseconds.
Option C is incorrect. In real-time processing, the processing of input data stream takes place with a shorter turnaround time. It is stream processing where processing is done just after the data is created.
Option D is incorrect. One of the main characteristics of the real-time data processing is that the processing of input data stream takes place with the minimized latency requirements to support real-time consumption, so high latency is not acceptable with real-time data processing.
Reference: To know more about the Real-time Processing, refer to the documentation below from Azure:
https://docs.microsoft.com/en-us/azure/architecture/data-guide/big-data/real-time-processing
Question 5
Read the statement - "In relational databases, all the values in a column will have the same data type."
Choose the correct option with respect to the given statement.
- Yes
- No
Correct answer: A
Explanation:
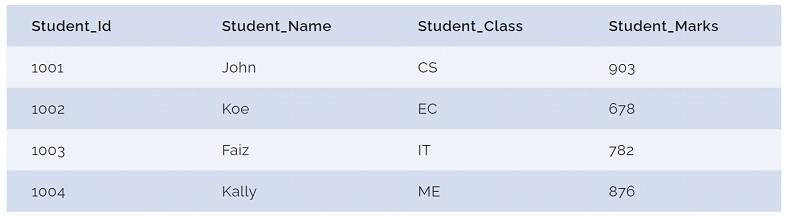
A relational database stores data and provides access to data points that are related to each other. A relational database follows the basic relational model that is a simple and straightforward method of storing data in tables. Each row of the table in a relational database represents a record with a unique id i.e. key.Each column of the table holds an attribute of the data, and each record represents the value for each attribute.For example, a table STUDENT_RECORD represents the record of students in a class and the attributes of columns are - Student_Id, Student_Name, Student_Branch, and Student_Marks. We need to define the data type of each attribute in the beginning at the time of the creation of the table. Here, if we set Student_Id as a number, all the values in the column Student_Id will contain numbers only. And if we set it as alphanumeric, all the values in the column Student_Id will contain both alphabets and numbers. So, Option A is correct.Reference: To know more about the characteristics of Relational Databases, click the Lin below:https://docs.rackspace.com/support/how-to/properties-of-rdbmss-and-nosql-databases/ A relational database stores data and provides access to data points that are related to each other. A relational database follows the basic relational model that is a simple and straightforward method of storing data in tables. Each row of the table in a relational database represents a record with a unique id i.e. key.
Each column of the table holds an attribute of the data, and each record represents the value for each attribute.
For example, a table STUDENT_RECORD represents the record of students in a class and the attributes of columns are - Student_Id, Student_Name, Student_Branch, and Student_Marks. We need to define the data type of each attribute in the beginning at the time of the creation of the table. Here, if we set Student_Id as a number, all the values in the column Student_Id will contain numbers only. And if we set it as alphanumeric, all the values in the column Student_Id will contain both alphabets and numbers.
So, Option A is correct.
Reference: To know more about the characteristics of Relational Databases, click the Lin below:
https://docs.rackspace.com/support/how-to/properties-of-rdbmss-and-nosql-databases/
Question 6
An organization has been using a bar chart to present the year-wise sales of a region to track the status of sales year by year. How would you recognize the analytics here?
- Descriptive
- Diagnostic
- Predictive
- Prescriptive
Correct answer: A
Explanation:
Let's understand the different types of data analytics to find how Diagnostic analytics is the correct option here.Descriptive Analytics explains what happened in the past. It provides context to the businesses and helps to understand how it is performing. It can be represented as data visualizations such as charts, graphs, dashboards, and reports.Diagnostic Analytics explains why something has happened in the past. It takes the descriptive data to the next level and provides a deeper analysis of why something happened. It is also known as root cause analysis and includes data discovery, data mining, drill down, and drill through.Predictive Analytics predicts what's most likely to happen in the future. It takes historical data and uses a machine learning model to predict what will happen next.Prescriptive Analytics explains the actions to take to affect the upcoming results. It takes predictive data to the next level and suggests actions to be performed along with the outline of potential implications.Option A is Correct. The descriptive analytics uses charts, graphs, dashboards, and reports to present what happened in the past and how it is performing. Here, the aim of creating bar chart is to track the year-wise sale.Option B is incorrect. Diagnostic analytics explains why something happened in the past to find the root cause.Here, the organization is using a bar chart just to track the sales, not the cause of increase or decrease. Option C is incorrect. Predictive analytics is done to predict what will happen in the future while here, the bar chart is presenting the past data of sales of the organization.Option D is incorrect. Prescriptive analytics explains the set of actions to be performed as per the predictive analytics while here, the bar chart is presenting the past data of sales of the organization.Reference: To know more about the different types of data analytics, refer to the link below:https://www.logianalytics.com/predictive-analytics/comparing-descriptive-predictive-prescriptive-and-diagnostic-analytics/ Let's understand the different types of data analytics to find how Diagnostic analytics is the correct option here.
Descriptive Analytics explains what happened in the past. It provides context to the businesses and helps to understand how it is performing. It can be represented as data visualizations such as charts, graphs, dashboards, and reports.
Diagnostic Analytics explains why something has happened in the past. It takes the descriptive data to the next level and provides a deeper analysis of why something happened. It is also known as root cause analysis and includes data discovery, data mining, drill down, and drill through.
Predictive Analytics predicts what's most likely to happen in the future. It takes historical data and uses a machine learning model to predict what will happen next.
Prescriptive Analytics explains the actions to take to affect the upcoming results. It takes predictive data to the next level and suggests actions to be performed along with the outline of potential implications.
Option A is Correct. The descriptive analytics uses charts, graphs, dashboards, and reports to present what happened in the past and how it is performing. Here, the aim of creating bar chart is to track the year-wise sale.
Option B is incorrect. Diagnostic analytics explains why something happened in the past to find the root cause.
Here, the organization is using a bar chart just to track the sales, not the cause of increase or decrease.
Option C is incorrect. Predictive analytics is done to predict what will happen in the future while here, the bar chart is presenting the past data of sales of the organization.
Option D is incorrect. Prescriptive analytics explains the set of actions to be performed as per the predictive analytics while here, the bar chart is presenting the past data of sales of the organization.
Reference: To know more about the different types of data analytics, refer to the link below:
https://www.logianalytics.com/predictive-analytics/comparing-descriptive-predictive-prescriptive-and-diagnostic-analytics/
Question 7
You are working in an organization and your client wants to migrate all of his SQL workloads to the Azure such that complete SQL Server compatibility and operating system-level access will be maintained. Which Azure Database would you recommend to the client?
- Azure SQL Database
- Azure Cosmo DB
- Azure SQL Managed Instance
- SQL Server on Virtual Machines
Correct answer: D
Explanation:
SQL Server for Virtual Machines Azure database is responsible to migrate the SQL workloads on Azure while maintaining the operating system-level access and SQL Server compatibility. So, in the given scenario, SQL Server on Virtual Machines will be the right choice.Option A is incorrect. Azure SQL Database is an up-to-date relational database service with hyper scale storage, serverless compute, automated, and AI-powered features for the optimization of durability and performance.Option B is incorrect. Azure SQL Managed Instance enables the migration of SQL workloads to Azure and maintains SQL Server Compatibility with the benefits of an evergreen, fully managed Paas.Option C is incorrect. Azure Cosmos DB enables building applications with high availability and low latency, at any scale, and anywhere. It also enables the migration of MongoDB, Cassandra, and other NoSQL workloads to the cloud.Option D is correct. SQL Server for Virtual Machines Azure database is responsible to migrate the SQL workloads on Azure while maintaining the operating system-level access and SQL Server compatibility.Reference: To know more about the Azure database products, refer to the link below:https://azure.microsoft.com/en-in/product-categories/databases/ SQL Server for Virtual Machines Azure database is responsible to migrate the SQL workloads on Azure while maintaining the operating system-level access and SQL Server compatibility. So, in the given scenario, SQL Server on Virtual Machines will be the right choice.
Option A is incorrect. Azure SQL Database is an up-to-date relational database service with hyper scale storage, serverless compute, automated, and AI-powered features for the optimization of durability and performance.
Option B is incorrect. Azure SQL Managed Instance enables the migration of SQL workloads to Azure and maintains SQL Server Compatibility with the benefits of an evergreen, fully managed Paas.
Option C is incorrect. Azure Cosmos DB enables building applications with high availability and low latency, at any scale, and anywhere. It also enables the migration of MongoDB, Cassandra, and other NoSQL workloads to the cloud.
Option D is correct. SQL Server for Virtual Machines Azure database is responsible to migrate the SQL workloads on Azure while maintaining the operating system-level access and SQL Server compatibility.
Reference: To know more about the Azure database products, refer to the link below:
https://azure.microsoft.com/en-in/product-categories/databases/
Question 8
Fill in the blank:
A database index allows a query to __________ data efficiently from a database.
- Delete
- Retrieve
- Find
- Search
Correct answer: B
Explanation:
A database index consists of one or more keys and is related to the specific tables. It allows a query to retrieve data efficiently from a database. As a database index increases the speed of data retrieval, it is required to define correct indexes for each table.Option A is incorrect. A database index allows a query to retrieve, not delete data efficiently from a database.Option B is correct. A database index allows a query to retrieve data efficiently from a database.Option C is incorrect. A database index allows a query to retrieve, not find data efficiently from a database.Option D is incorrect. A database index allows a query to retrieve, not search for data efficiently from a database. A database index consists of one or more keys and is related to the specific tables. It allows a query to retrieve data efficiently from a database. As a database index increases the speed of data retrieval, it is required to define correct indexes for each table.
Option A is incorrect. A database index allows a query to retrieve, not delete data efficiently from a database.
Option B is correct. A database index allows a query to retrieve data efficiently from a database.
Option C is incorrect. A database index allows a query to retrieve, not find data efficiently from a database.
Option D is incorrect. A database index allows a query to retrieve, not search for data efficiently from a database.
Question 9
You need to design and model a database by using a graphical tool that supports project-oriented offline database development.
What should you use?
- Microsoft SQL Server Data Tools (SSDT)
- Microsoft SQL Server Management Studio (SSMS)
- Azure Databricks
- Azure Data Studio
Correct answer: A
Explanation:
https://docs.microsoft.com/en-us/sql/ssdt/project-oriented-offline-database-development?view=sql-server-ver15 https://docs.microsoft.com/en-us/sql/ssdt/project-oriented-offline-database-development?view=sql-server-ver15
Question 10
You have a transactional application that stores data in an Azure SQL managed instance.
When should you implement a read-only database replica?
- You need to generate reports without affecting the transactional workload.
- You need to audit the transactional application.
- You need to implement high availability in the event of a regional outage.
- You need to improve the recovery point objective (RPO).
Correct answer: A
Explanation:
Use read-only replicas to offload read-only query workloads.Reference:https://docs.microsoft.com/en-us/azure/azure-sql/database/read-scale-out Use read-only replicas to offload read-only query workloads.
Reference:
https://docs.microsoft.com/en-us/azure/azure-sql/database/read-scale-out
HOW TO OPEN VCE FILES
Use VCE Exam Simulator to open VCE files
HOW TO OPEN VCEX AND EXAM FILES
Use ProfExam Simulator to open VCEX and EXAM files

ProfExam at a 20% markdown
You have the opportunity to purchase ProfExam at a 20% reduced price
Get Now!